Файл:Kinked demand.svg
Перейти к навигации
Перейти к поиску

Размер этого PNG-превью для исходного SVG-файла: 580 × 480 пкс. Другие разрешения: 290 × 240 пкс | 928 × 768 пкс | 1237 × 1024 пкс | 2475 × 2048 пкс.
Исходный файл (SVG-файл, номинально 580 × 480 пкс, размер файла: 2 КБ)
Этот файл находится на Викискладе. Сведения о нём показаны ниже.
Викисклад — централизованное хранилище для свободных файлов, используемых в проектах Викимедиа.
|

|
Этот SVG-файл включает встроенный текст, который может быть переведён на ваш язык с помощью любого SVG-редактора, текстового редактора или Инструмента по переводу SVG-файлов. За подробной информацией обратитесь к статье О переводе SVG-файлов. |
| Описание |
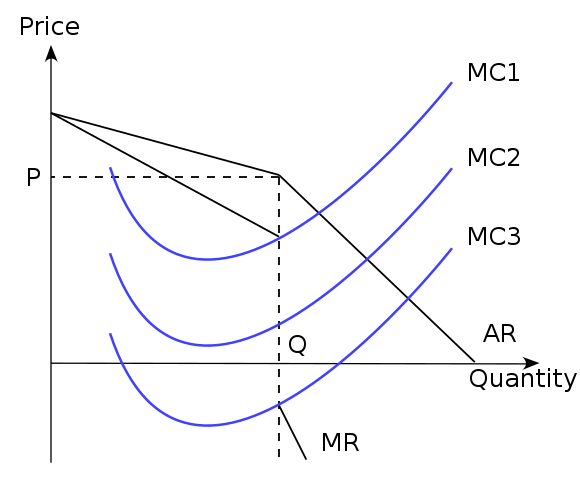
English: A diagram illustrating kinked demand, one formulation for explaining price stability in oligopolies. The demand curve the oligopolist faces is that of two separate curves spliced together, creating a discontinuity in the MR curve. This means that a profit maximising firm will still produce at quantity Q and price P if marginal costs are equal to MC1, MC2 or MC3, thus explaining price stability. (Here, both curves are illustrated as linear, though the concept would work exactly the same if they were not.) |
| Дата | (UTC) |
| Источник | |
| Автор |
|
Этот файл доступен по лицензии Creative Commons Attribution-Share Alike 3.0 Unported.
- Вы можете свободно:
- делиться произведением – копировать, распространять и передавать данное произведение
- создавать производные – переделывать данное произведение
- При соблюдении следующих условий:
- атрибуция – Вы должны указать авторство, предоставить ссылку на лицензию и указать, внёс ли автор какие-либо изменения. Это можно сделать любым разумным способом, но не создавая впечатление, что лицензиат поддерживает вас или использование вами данного произведения.
- распространение на тех же условиях – Если вы изменяете, преобразуете или создаёте иное произведение на основе данного, то обязаны использовать лицензию исходного произведения или лицензию, совместимую с исходной.
Исходный журнал загрузок
This image is a derivative work of the following images:
- File:Perfect_competition_in_the_short_run.svg licensed with Cc-by-sa-3.0
- 2010-10-15T16:18:39Z Jarry1250 580x400 (2908 Bytes) == int:filedesc == == int:filedesc == Better economics
- 2010-10-05T20:59:03Z Jarry1250 560x400 (3824 Bytes) == Summary == Economics error fixed.
- 2010-10-05T20:52:52Z Jarry1250 560x400 (3823 Bytes) == Summary == Try to realign again.
- 2010-10-05T20:51:10Z Jarry1250 560x400 (3823 Bytes) == Summary == == Summary == Minor fixes
- 2010-10-05T20:45:52Z Jarry1250 560x400 (3803 Bytes) {{Information |Description={{en|Diagram showing that it is possible that a firm in [[:en:perfect competition|]] makes an [[:en:Economic profit|abnormal profit]], if P > min(ATC). In the [[:en:long run|]], however, only normal
Uploaded with derivativeFX
История файла
Нажмите на дату/время, чтобы посмотреть файл, который был загружен в тот момент.
| Дата/время | Миниатюра | Размеры | Участник | Примечание | |
|---|---|---|---|---|---|
| текущий | 19:40, 1 января 2011 | | 580 × 480 (2 КБ) | Jarry1250 | {{Translation possible}} {{Information |Description={{en|A diagram illustrating en:kinked demand, one formulation for explaining price stability in oligopolies. The demand curve the oligopolist faces is that of two separate curves |
Использование файла
Следующая страница использует этот файл:
Глобальное использование файла
Данный файл используется в следующих вики:
- Использование в en.wikipedia.org
- Использование в fr.wikipedia.org
- Использование в hy.wikipedia.org
- Использование в kn.wikipedia.org