Файл:Climate visualization.jpg
Перейти к навигации
Перейти к поиску
Размер этого предпросмотра: 746 × 600 пкс. Другие разрешения: 299 × 240 пкс | 597 × 480 пкс | 955 × 768 пкс | 1273 × 1024 пкс | 1323 × 1064 пкс.
Исходный файл (1323 × 1064 пкс, размер файла: 137 КБ, MIME-тип: image/jpeg)
Этот файл находится на Викискладе. Сведения о нём показаны ниже.
Викисклад — централизованное хранилище для свободных файлов, используемых в проектах Викимедиа.
|
Краткое описание
| Описание |
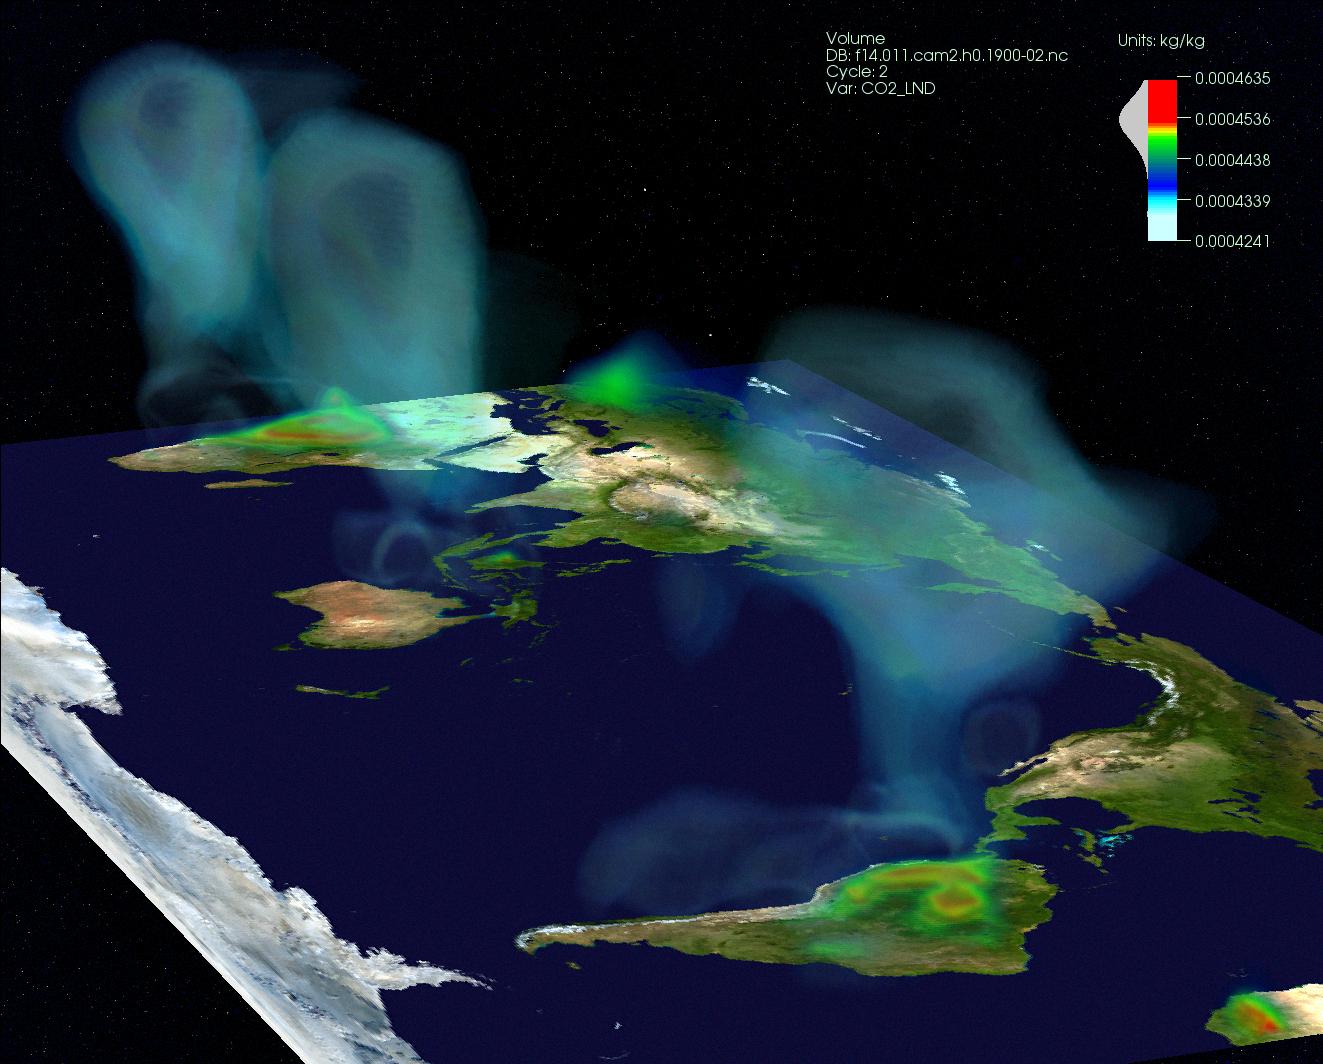
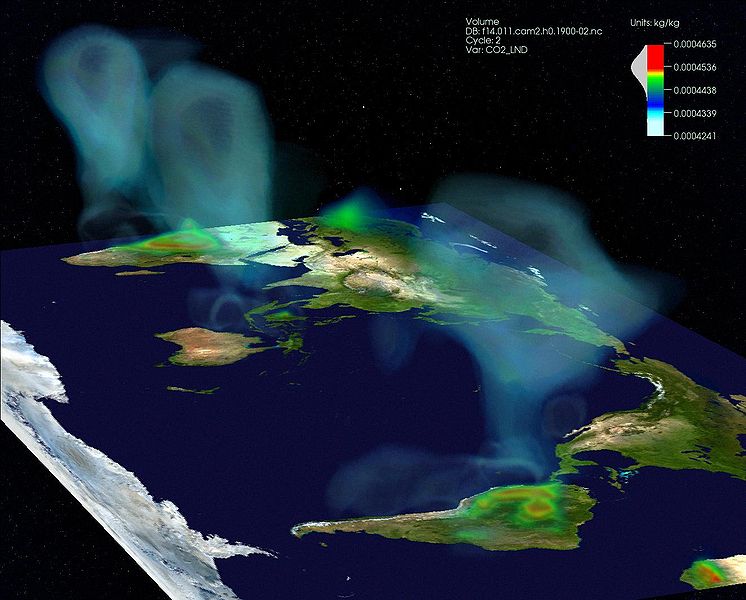
English: Climate visualization
This visualization depicts the carbon dioxide from various sources that are advected individually as tracers in the atmosphere model. Carbon dioxide from the ocean is shown as plumes during Feb. 1900. Image courtesy of Forrest Hoffman and Jamison Daniel of Oak Ridge National Laboratory. |
| Дата | Updated: November 8, 2007 |
| Источник | Visualizations that have been created with VisIt. at wci.llnl.gov |
| Автор | UCRL and Forrest Hoffman and Jamison Daniel of Oak Ridge National Laboratory |
Лицензирование
Это произведение находится в общественном достоянии (англ. public domain) в Соединённых Штатах Америки, так как оно является работой, выполненной должностным лицом или наёмным сотрудником Федерального правительства США в качестве части служебных обязанностей этого лица. Правовой статус регламентируется в соответствии с разделом 17, главой 1, секцией 105 Кодекса Соединённых Штатов. См. Авторское право.
Обратите внимание: это относится только к оригинальным (первоначальным) произведениям Федерального правительства, а не к произведениям любого отдельного штата США, территории, содружества, округа, муниципалитета или любой другой территориальной единицы. Этот шаблон также не относится к дизайну почтовых марок, изданных Почтовой службой США с 1978 года. (См. § 313.6(C)(1) в Compendium of U.S. Copyright Office Practices). Это также не относится к определённым монетам США; см. Условия использования Монетного двора США.
|
 | |
| Этот файл был определён как свободный от известных ограничений авторского права, а также связанных и смежных прав. | ||
История файла
Нажмите на дату/время, чтобы посмотреть файл, который был загружен в тот момент.
| Дата/время | Миниатюра | Размеры | Участник | Примечание | |
|---|---|---|---|---|---|
| текущий | 00:26, 11 июля 2008 | | 1323 × 1064 (137 КБ) | Mdd | {{Information |Description={{en|1=Climate visualization This visualization depicts the carbon dioxide from various sources that are advected individually as tracers in the atmosphere model. Carbon dioxide from the ocean is shown as plumes during Feb. 1900 |
Использование файла
Следующие 2 страницы используют этот файл:
Глобальное использование файла
Данный файл используется в следующих вики:
- Использование в en.wikipedia.org
- Использование в et.wikipedia.org
- Использование в it.wikipedia.org
- Использование в zh.wikipedia.org